Getting started
This manual provides step-by-step guides to briefly introduce the main work steps.
- New File (image preprocessing)
- Open file (preprocessed data)
- Segmentation
- Select items in the gallery
- Sorting and ranking
- Classifier training
- Data export
- Plots
- List of Applicaton Shortcuts
New File - image preprocessing
- Menu:
File->New data file or click on "new"-icon
 in the tool bar
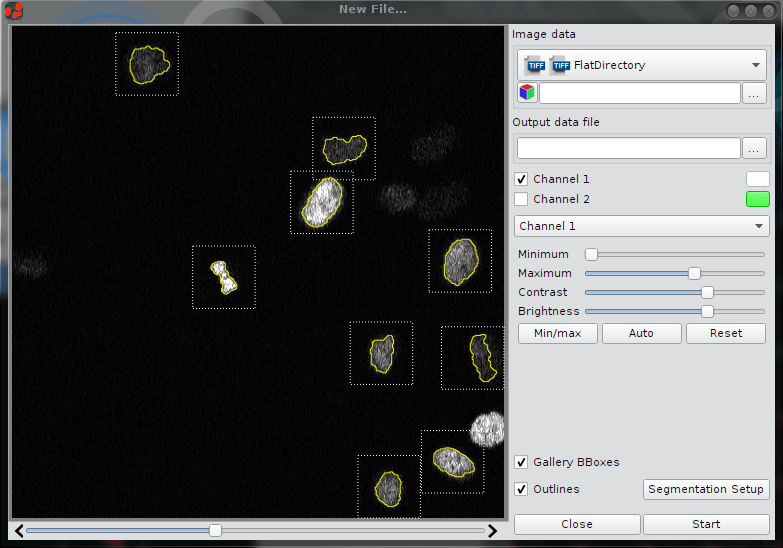
 - Fill out the form (see figure below)
- Choose directory and directory structure: Flat Directory or DircetoryPerTreatment
- Setup image directory
- Setup data file (output file)
- Click the check boxes to show Outlines and Gallery BBoxes
- Clikt the Button Segmentation Setup to adjust segmentation parameters.
Segmenation
- Select a color channel for primary segmentation (drop down menu in the upper left corner).
- Select a segmentation algorithm (drop down menu in the uppler right corner).

Open File
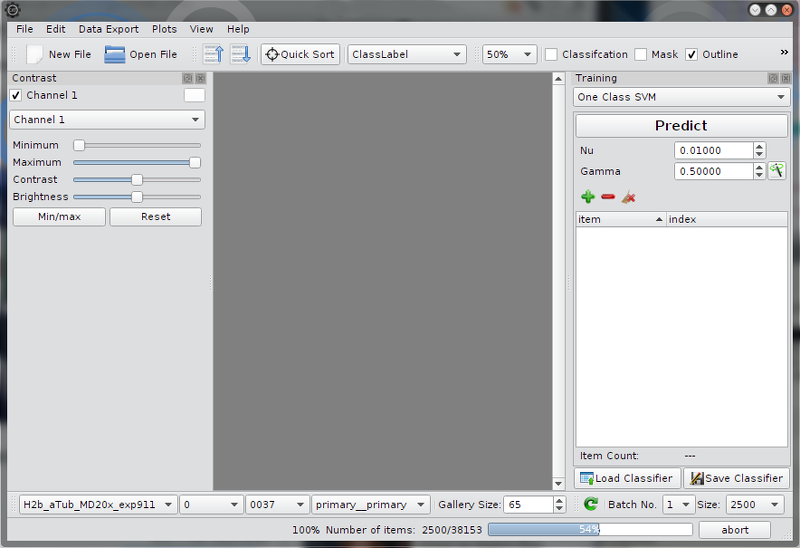
There are three ways to open a data file:
- Menu: File->Open File
- Press the Open File icon
 in the tool bar
 - Drag & Drop: drag the data file from the file manager and drop it in the main window (anywhere, except in the central gallery viewer)
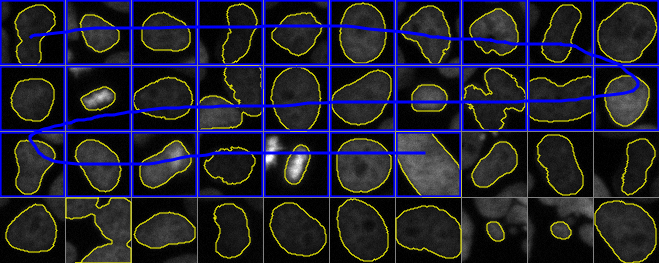
Select items in the gallery viewer:
- Douple click on an item. (selects only one item)
- Click on multiple items while the Ctrl-button is pressed
- Drage the mouse over multiple items while the Ctrl-button is pressed
The gallery view has a context Menu. Note the sub menu Quick Sort, which is a efficient and fast way for sorting the gallery.
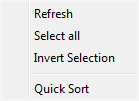
- Refresh - updates the display (shortcut "F5").
- Select all - select all items in the gallery.
- Invert selection - invert selection in the gallery.
- Quick Sort - sort the items by cosine similarly, the currently selected item(s) serve as reference example for the similarity measure.
Sorting and Ranking
- Select at least one item in the gallery.
- Click on the Quick Sort button in the toolbar or
- Click on the Quick Sort button in the context menu
Classifier training
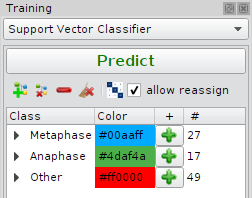
- Choose a classifier in the drop down menau (SVC, One class SVM or Manual Classifier)
- Setup the classes (
 button in the tool bar)
 - Select items in the gallery and press the
 -button to assign the sample to a certain class.
 - Hover the other buttons and controls to see tooltips
- There is a big button labeled "Predict"
Data Export
The Menu Data Export offers three options:
- Screenshot of the gallery
- Table of class counts
- Data table (one line per cell)
Plots:
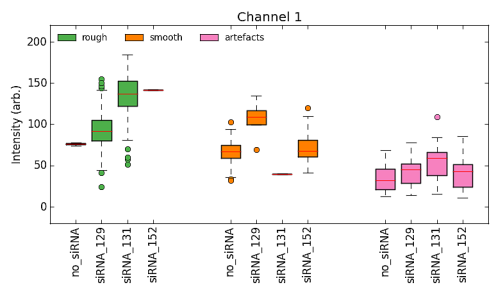
Simple box- and bar graphs can be displayed using either the corresponding menu or shortcuts (P+ 1-5). The plots give a quick overview over the class counts and dedicated features.
Following plots are available:
- Bargraph grouped by class.
- Bargraph grouped by treatment.
- Boxplot - Intesity
- Boxplot - Size
- Boxplot - Standard Deviation of Intesity
